Balance Sheet
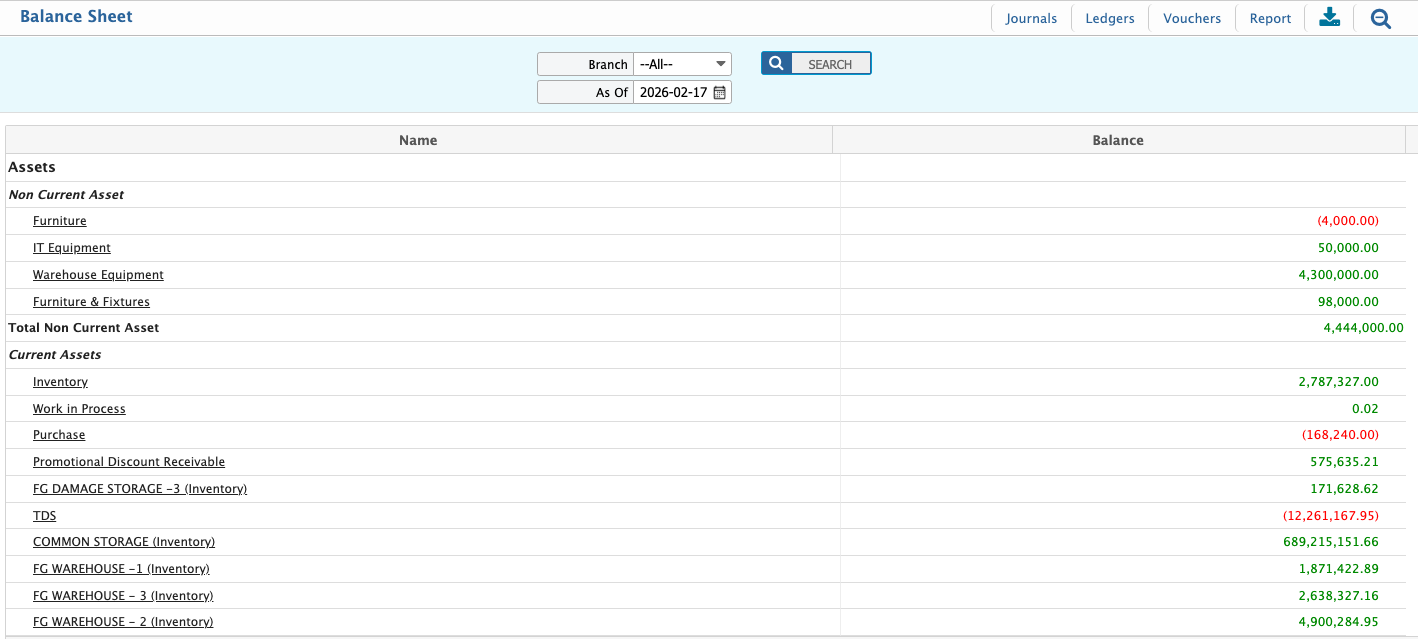
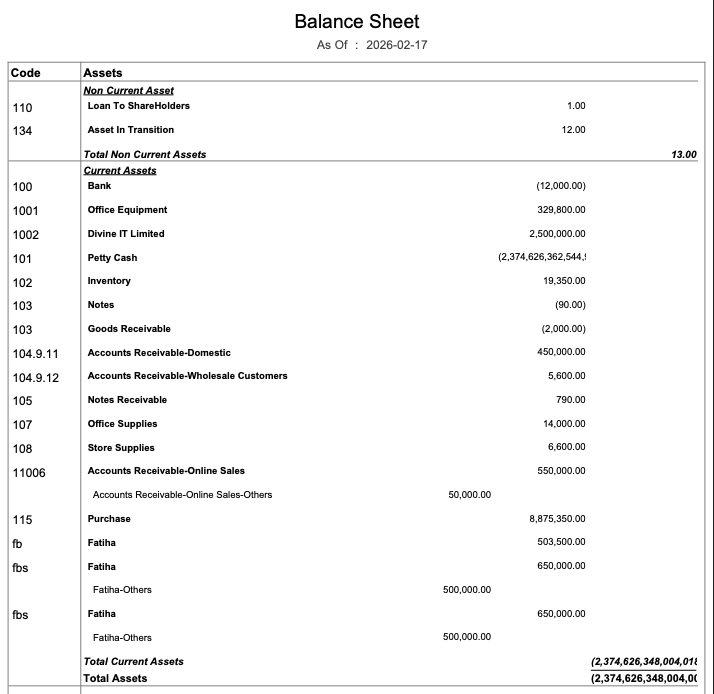
The Balance Sheet provides a clear view of a company’s financial position on a specific date, showing what the organization owns (assets), owes (liabilities), and the owner’s equity. This report, generated in PrismERP, helps management monitor liquidity, evaluate obligations, and track overall net worth. Users can generate the report for a specific branch or for all branches and view it at different levels of detail depending on their analysis needs.
Details View & Action Table
| Field | Action |
|---|---|
| Go to | Navigate to Reports → Financial Statements → Balance Sheet to open the report screen. |
| From | Select the starting date for the reporting period. Transactions from this date onward will be included. |
| To | Select the ending date for the reporting period. All transactions up to this date will be included. |
| Branch | Select the branch for which the report will be generated. Selecting All includes all branches. |
| Level | Select the level of detail for the report. |
| Generate Report | Click Preview or Print Report to produce the Balance Sheet based on the selected filters and level of detail. |
| Outline | Set the report outline including header, footer, and page orientation to customize the layout of the printed or exported report. |
| Export / Print | Download the report in PDF, DOC, HTML, Excel, or CSV formats directly from the system, or print it for financial review and documentation purposes. |
Users can also view a chart of the Balance Sheet in PrismERP, which shows assets, liabilities, and equity visually. The chart can be filtered by branch and by date, and users can also download it in HTML format.